
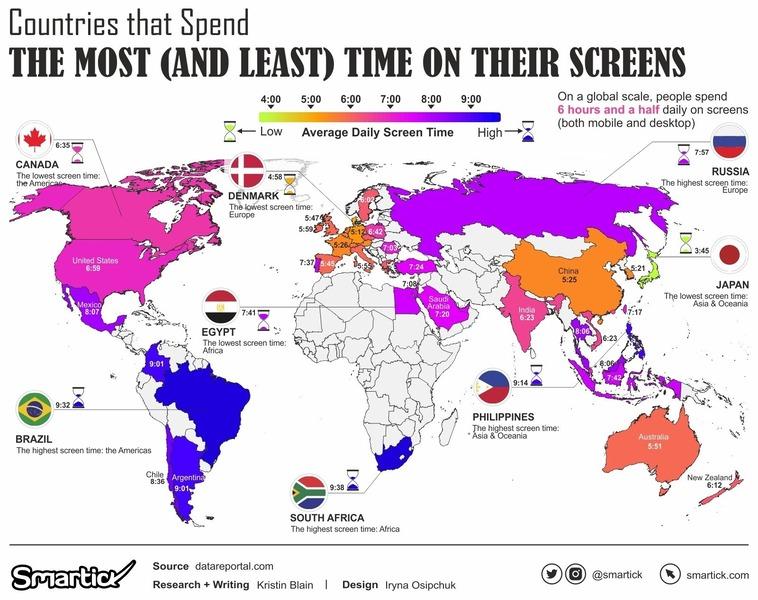
Smartick gathered data from DataReportal.com on digital behaviour to put together maps showing who’s the most online.
South Africa spends the most time on desktop and mobile, averaging nearly 10 hours a day per internet user. Brazil, Philippines, Argentina and Colombia also average more than nine hours a day. South Africa also wins the award for most internet usage via a computer, with almost 4.5 hours per day. Russia, Brazil, Argentina and Colombia were also quite close to the four-hour mark.
I dug through the DataReportal website to try to find out why this is. This specific dataset is sourced from GWI, but DataReportal does not go into the actual specifics of the “why”., except to state: “this may suggest that users in lower- and middle-income countries (LMICs) have increased the amount of time that they spend online, even as users in more developed economies reduce their online activity”. They also go on to say: “the median age of the population is also a key factor. Overall, average daily internet time tends to decrease with age, which may explain why Japan sits at the bottom end of this ranking”.
The median age of South Africa’s population is 27.5 years old. One interesting statistic in South Africa is that the unemployment rate is just under 40%, and if I remember correctly, for the youth it is around 60%. But there is no evidence presented that this has any correlation with Internet usage.
Social media usage shows the highest numbers of South Africans on Facebook (22.15 million but has decreased by 8.5%), YouTube (25.8 million), and TikTok (11.83 million which is a massive 83% increase). LinkedIn is also well represented with 11.00 million users, but Twitter is as low as 3.65 million users (65% skewed towards males, although the Twitter data seems to vary quite a bit).
South African Instagram’s users are now at 5.65 million, but is a 9.9% decline in numbers. Snapchat users have also declined by 6.4% to now show 5.85 million South Africans.
So, it does look like users are using Facebook a bit less and using YouTube and TikTok a lot more. Would this mean that this is where South African Internet users are spending their time?
Bearing in mind that 2024 is going to be an interesting election year in South Africa, the release of the ad reach per platform is quite topical (as it is for other countries with elections in 2024).
A last thought of mine is, so, what happens when most users have veered off onto decentralised social media platforms that do not make a point of gathering and reporting on all this user data? It’s going to be a whole new intriguing challenge to reach populations in 5 to 10 years’ time.