
There’s an old adage that says ‘What you cannot measure, you cannot manage’ which is actually not fully true, because many things have to be managed that do not have any hard metrics to go by. But the principle of having some signals and metrics does indeed greatly assist with determining whether a service is improving or declining. For the Department of Home Affairs, this would include a metric to indicate the mainframe service is fully operational, and then a metric for each and every remote DHA office’s connectivity status. From a technology perspective, if those lights were all green, it should be 100% operational. If the mainframe system is not green, then everything is unavailable countrywide. If some site offices show red lights, it means they have no connectivity at those DHA offices.
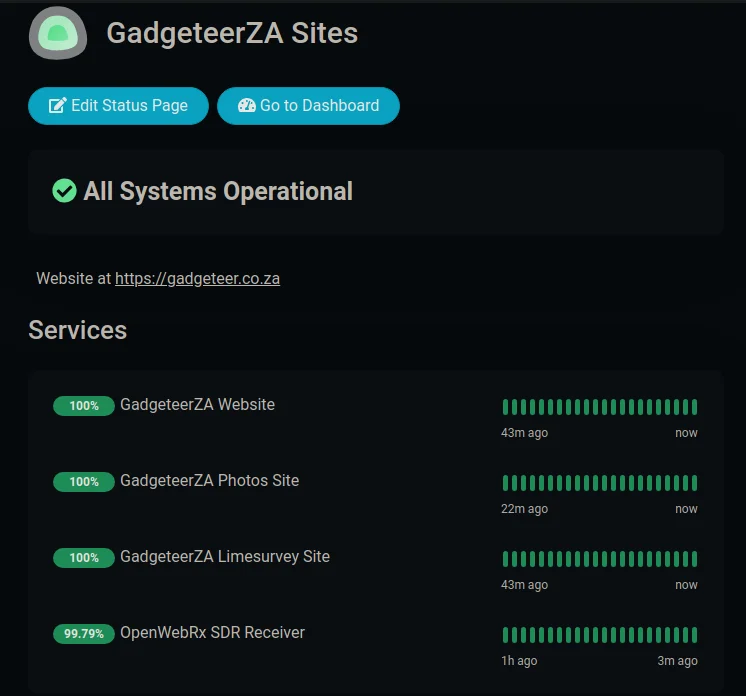
This should not be very complicated, as there are many free and open source tools that do this type of job very well. For such example is Uptime Kuma which I use to monitor and alert me of issues with my own hosted services (pictured below). Home Assistant and Grafana can also be used to provide additional analytics and alerting if necessary to e-mail addresses, mobile phones, Telegram Groups, etc. There are probably other uptime monitors that can do an even better job.
The SA Cabinet actually has (used to have) a policy around using primarily free and open source software where they can. So no tender is required to procure free and open source software. From the skills side, something like this generally requires no coding, and just some configuration. I’m very sure SITA still has the internal skills to be able to do this themselves. It is easier than designing a Drupal website. The biggest challenge is to just decide what are the best metrics to actually measure, e.g. ping time to every remote site. But even a start would be something better than what we don’t see right now.
It is vitally important that the accountable Minister is able to have this dashboard and alerting available in order to see the improvement from any actions taken. Likewise, the Department also could/should be using this to measure the service levels from SITA and the 3rd party service providers. I know from experience that much of those metrics only get reported on after month end, and usually by the service providers themselves, not by any live dashboard that the Department has.
But it is also significant for citizens, who consume this service daily, and often have to stand in long queues for hours on end, only to hear later “the system is down” or “the network is down”, to also be able to at least see this dashboard in its live state. There is no reason to keep such a live status secret from the public. Citizens should be aware before they visit the DHA offices, or whilst standing in the queue, that the system is down, so that they can decide whether to come back another day, or postpone their visit. It is scary to think how much economic productivity time is wasted by so many citizens around the country, standing in these queues, when the system or lines are down.
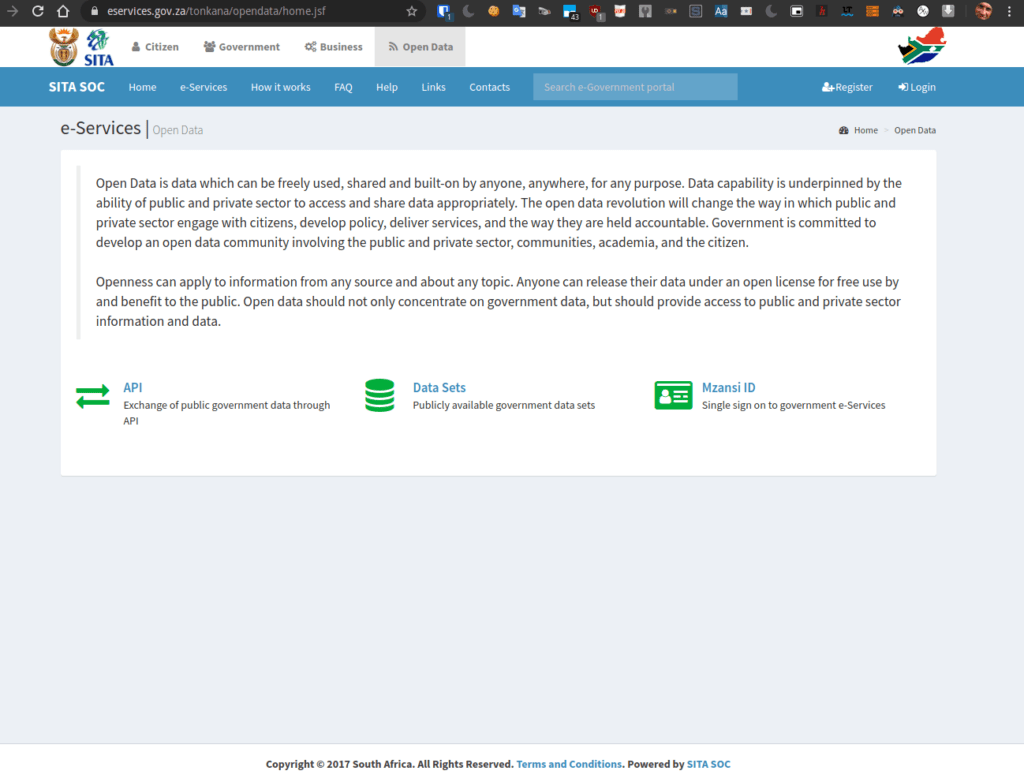
A good 10+ years ago the SA government had an approved eGOV Framework which promised an e-Services portal, built on open source software, and which would have APIs (application programming interfaces) available for 3rd parties to use. The Open Data philosophy was intended to improve transparency and accountability by government, and also to provide a source of data that private entrepreneurs could use to build businesses or sell value-added services on top of government’s open data (see image below). Some services today, such as Municipal Money, are built of top of data scraped from National Treasury and audit reports. These 3rd party services provide not only an important watchdog role, but also help citizens and businesses to make data-driven decisions themselves.
Taking the above into account, there is no reason why citizens should not be able to see such a real-time dashboard of availability of DHA services. Coming back to the old adage about ‘What you cannot measure, you cannot manage’, I’d certainly hope at least that the new Minister for DHA has access already to such a dashboard. If not, maybe the above ideas can help to ensure one is put in place pretty quickly. The more visibility and transparency around these services, will probably be better for all, and maybe even focus efforts on where the real issues are.
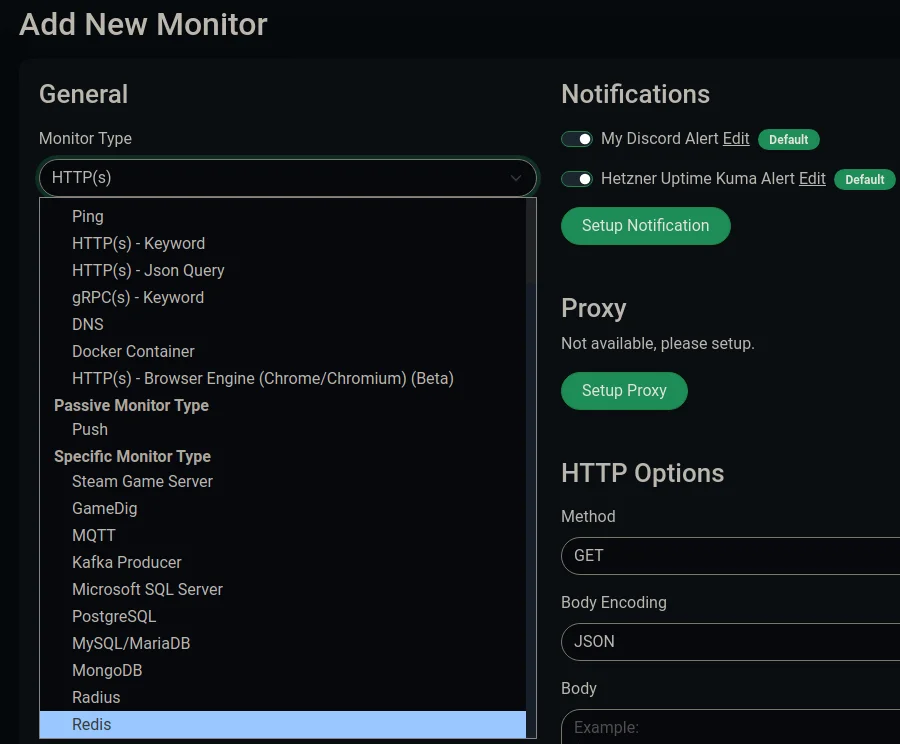
SITA’s DBA’s, network engineers, and mainframe operators/programmers should be able to advise which of the following monitor types (depicted below) can be effectively used to monitor the services. I know there is monitoring of each one of these services, but they are usually reported on retroactively, and they do not appear as a unified view of a single government service (Network engineers monitor their services separately from DBAs, who monitor separately from mainframe operators, etc). The whole aspect of monitoring needs to be adapted to show a client/citizen centric view, preferably with a single index score that can be measured for improvement and availability.